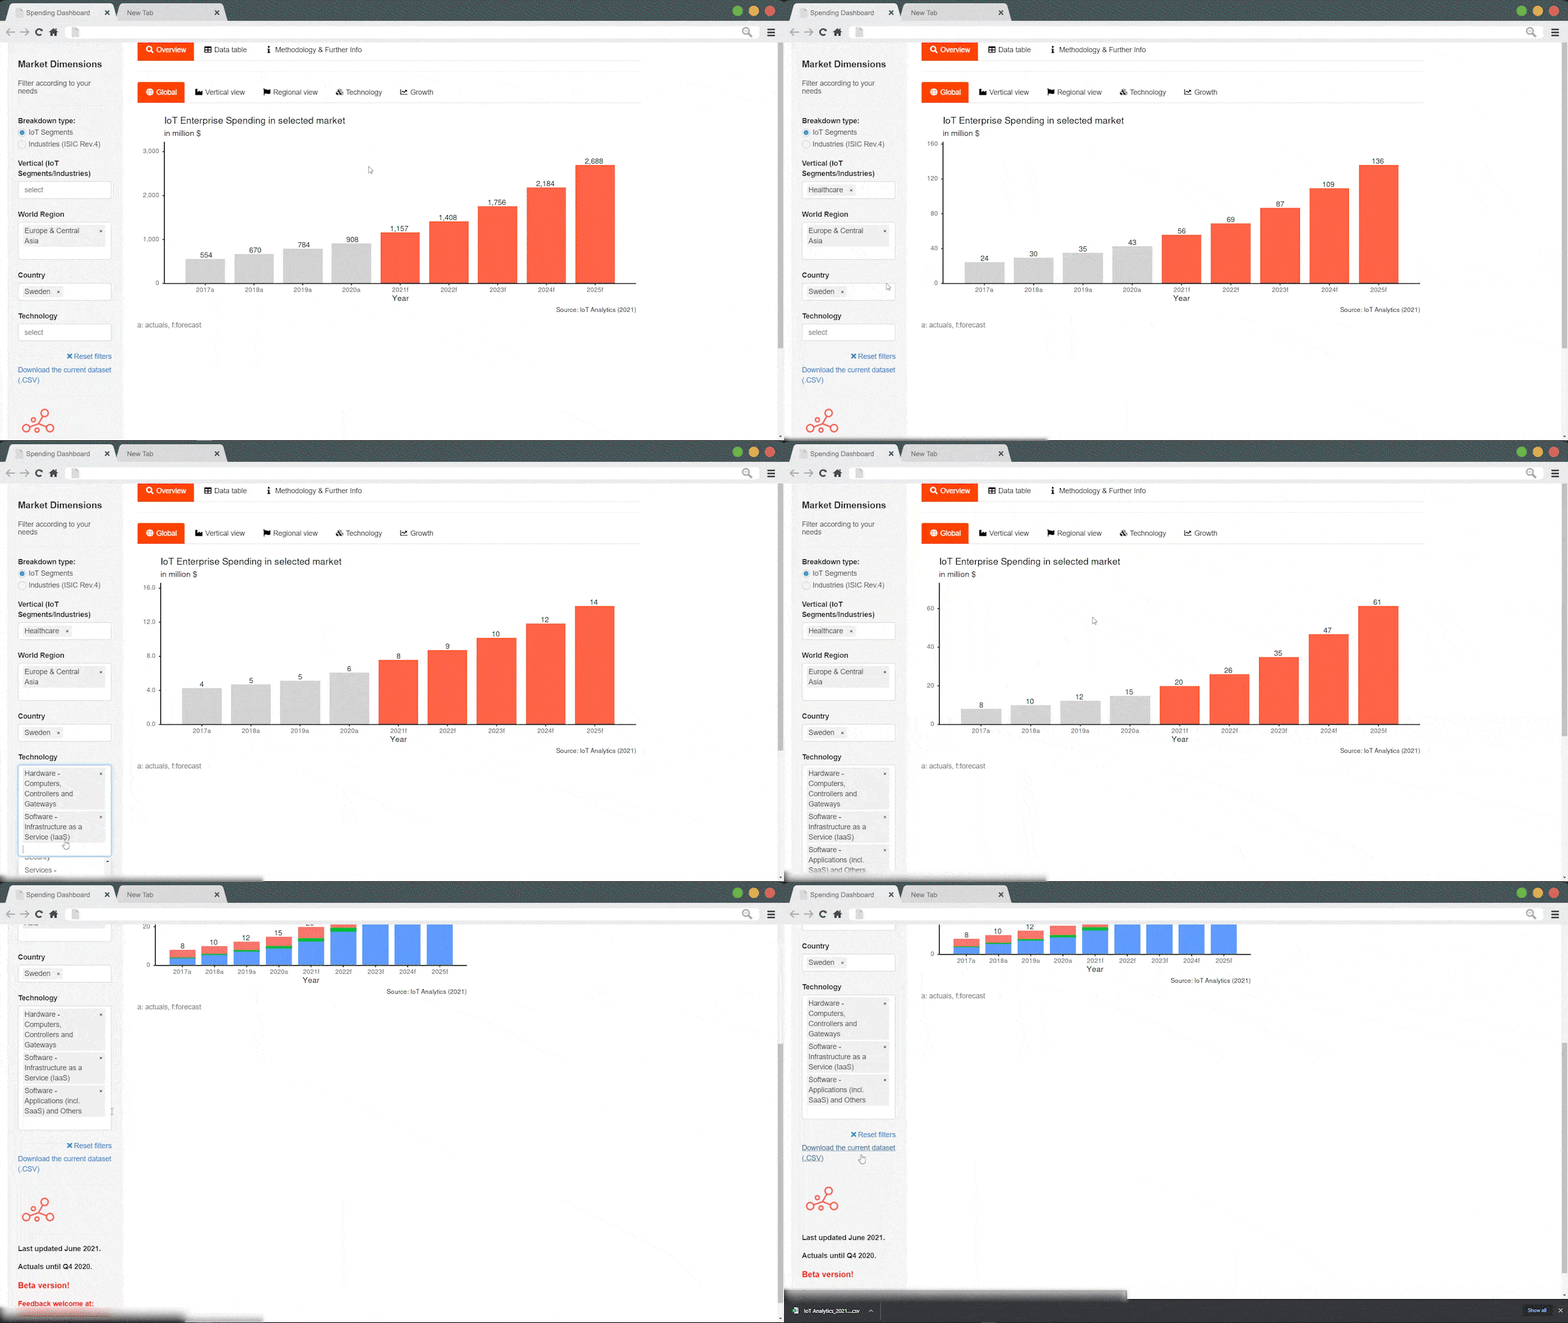
Structured market database and webtool
Discover in-depth data on 2G, 3G, 4G, 5G (RedCap), NB-IoT, and LTE-M
- In-depth look at the quarterly market for cellular IoT connectivity
- Includes over 4 thousand data points, that allow for detailed drill-down options per year or quarter, category, technology, and operator
- The tracker gets updated with the most recent data every 6 months
Database structure
View and analyze data points for
- 21 key telecom companies
- 9 cellular connectivity technologies
- 13 vertical IoT segments
The accompanying interactive webtool
Discover the Global Cellular IoT Connectivity Dashboard
Your Title Goes Here
Your content goes here. Edit or remove this text inline or in the module Content settings. You can also style every aspect of this content in the module Design settings and even apply custom CSS to this text in the module Advanced settings.
Click to show dashboard
Product specifications
All information about the tracker & forecast at a glance
General description
The Global Cellular IoT Connectivity Tracker is a structured market size and forecast database of worldwide cellular IoT connections, comprising the following technologies: 2G, 3G, 4G, 5G (including a breakdown of private and public 5G connections), 5G RedCap, NB-IoT, and LTE-M.
The tracker includes the number of active connections, revenue, and ARPU, along with forecasts for cellular IoT connections, by technology type, from 2024 to 2030.
Database structure
Timeframe
- Actuals: Quarterly (Q1 2018 – Q1 2024) & annual (2010-2023)
- Forecasts: Quarterly (Q2 2024 – Q4 2024) & annual (2024-2030)
- Companies: 21 mobile network operators
- Technologies: 9 cellular connectivity technologies
- Segments: 9 vertical IoT segments
- Regions: 11 regions
Metrics
Global cellular IoT active connections:
- Breakdown by technology pplits
- Breakdown by mobile network operators
- Breakdown by vertical IoT segments
- Breakdown by region
Global cellular IoT connectivity revenue:
- Breakdown by mobile network operators
- Breakdown by technology splits
- Breakdown by vertical IoT segments
Global Cellular IoT ARPU (Average Revenue Per User)”:
- Breakdown by mobile network operators
- Breakdown by technology splits
- Breakdown by vertical IoT segments
Global cellular 5G & 5G RedCap IoT connections:
-
- Breakdown by deployment type
Selected companies mentioned in the tracker & forecast
| Airtel | ATT | China Mobile | China Telecom | China Unicom |
| Deutsche Telekom | KDDI | KD Corp | LGUplus | NTTDocomo |
| Orange | SKTelecom | SoftBank | Sprint | Telefonica |
| Telenor | Telia | Telstra | Tmobile USA | Verizon |
| Vodafone |
Industry verticals covered in the tracker & forecast
| Building & infrastructure | Embedded automotive | Fixed access points | Home & consumer |
| Health care | Industrial & manufacturing | Mobile access points | Other energy |
| Retail | Smart Cities & others | Smart meters | Telematics - OBD and aftermarket |
| Transportation, supply chain & logistics |
Latest data releases
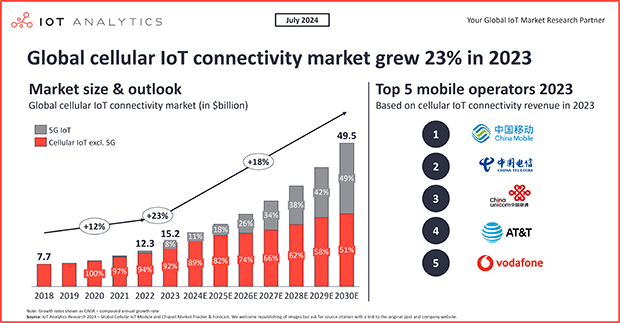
Global cellular IoT connectivity market reached $15B in 2023, 5G set to drive further growth
In short Mobile operators worldwide earned a combined $15 billion from 3.6 billion cellular IoT connections in 2023– according to IoT Analytics’ Global Cellular IoT Connectivity Tracker & Forecast (updated June 2024) and IoT Mobile Operator Pricing & Market Report 2024–2030 (released July 2024). Mobile operators’ IoT revenue growth rate of 23% YoY exceeded that of IoT software companies and hyperscalers in 2023. Cellular IoT connections grew even while the shipments and revenue for...
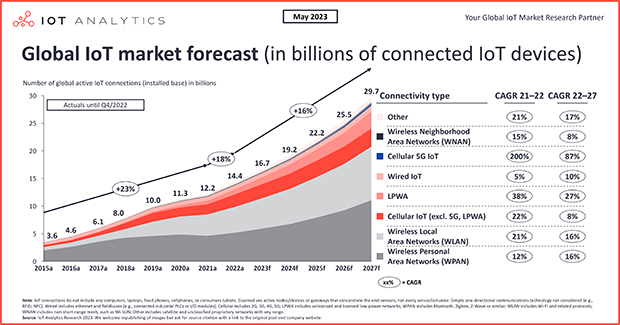
State of IoT 2023: Number of connected IoT devices growing 16% to 16.7 billion globally
IoT connections market update—May 2023 The latest IoT Analytics “State of IoT—Spring 2023” report shows that the number of global IoT connections grew by 18% in 2022 to 14.3 billion active IoT endpoints. In 2023, IoT Analytics expects the global number of connected IoT devices to grow another 16%, to 16.7 billion active endpoints. While 2023 growth is forecasted to be slightly lower than it was in 2022, IoT device connections are expected to continue to grow for many years to come. The...
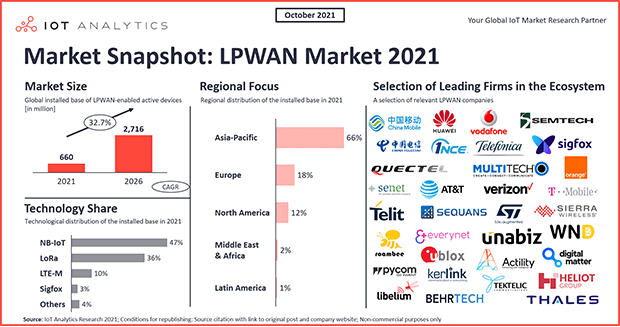
5 things to know about the LPWAN market in 2021
In short The low-power wide-area network (LPWAN) market had strong growth over the past two years despite COVID-19 and chipset shortages, according to the latest LPWAN Market Report 2021–2026.Four technologies account for over 95% of the global installed base.Adoption is strongest in China and the smart metering use case.The migration away from second generation/third generation (2G/3G) technology is happening slowly, while low-power satellite IoT connectivity is increasing. Why it matters?...
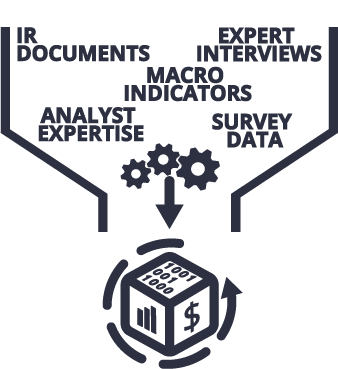
What we do to update the data every 6 months
- Constant monitoring of investor relations documents and news releases for hundreds of IoT companies and specifically the 33 companies that are part of this tracker.
- Industry-level forecasting based on revenue estimations of chipset vendors, module companies, and network operators.
- Interviewing of numerous senior IoT experts from connectivity chipset vendors, module companies and network operators.
- Approximating missing data using several indicators such as general country KPIs (e.g., GDP, population), number of companies supporting or adopting the technology, in a specific region or announcements of network roll-outs and deployments, etc.
Access the full version for hands-on help on your IoT connectivity journey
Understand the global cellular IoT market: market size, market growth, players, technologies, and pricing trends, including forecasts until 2027
Receive semi-annual data updates
Slice and dice the data according to your individual needs (e.g., by region or cellular connectivity technology)
Use the data to make better decisions in your profession
Our insights are trusted by


Request a free demo
Fill out the form to get in touch with us
- Experience a walk-through of the dashboard via screen share
- Get your specific questions addressed
- Explore how our research can add value to your organization
- Receive individual pricing and bundle

Prajwal Praveen
Sales Manager
Phone: + 49 (0) 408 221 1722
Email: sales@iot-analytics.com

