Structured market database and webtool
Get a holistic understanding of IoT markets
- Contains datasets for global enterprise IoT spending, IoT software application spending, and global IoT connections.
- Includes 800,000+ data points, with diverse breakdown options
- Gets updated with the most recent data every 6 months.

Data structure
View and analyze data points for
- 100+ countries from seven world regions
- 10 types of technology stack elements
- 11 vertical IoT segments
- 75+ industries
- 100+ vendors
- 40+ use cases
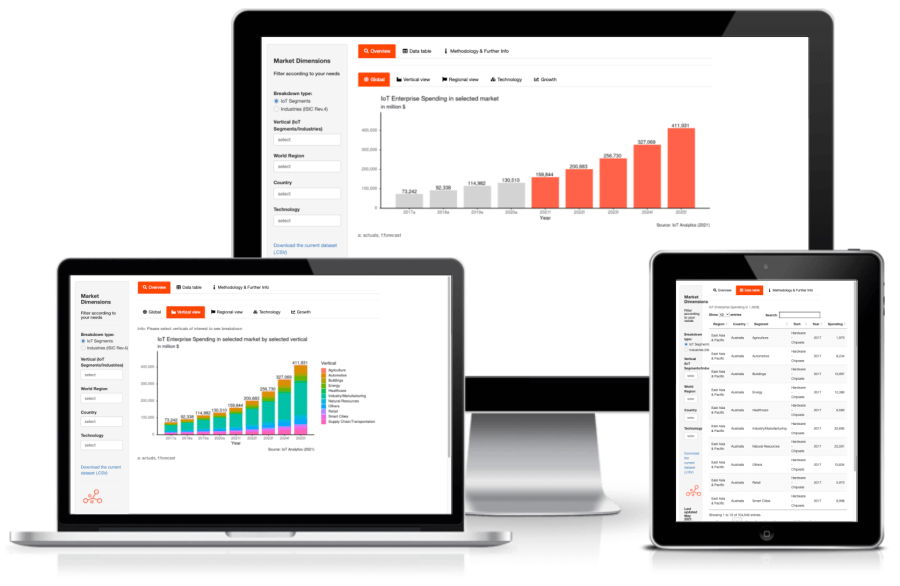
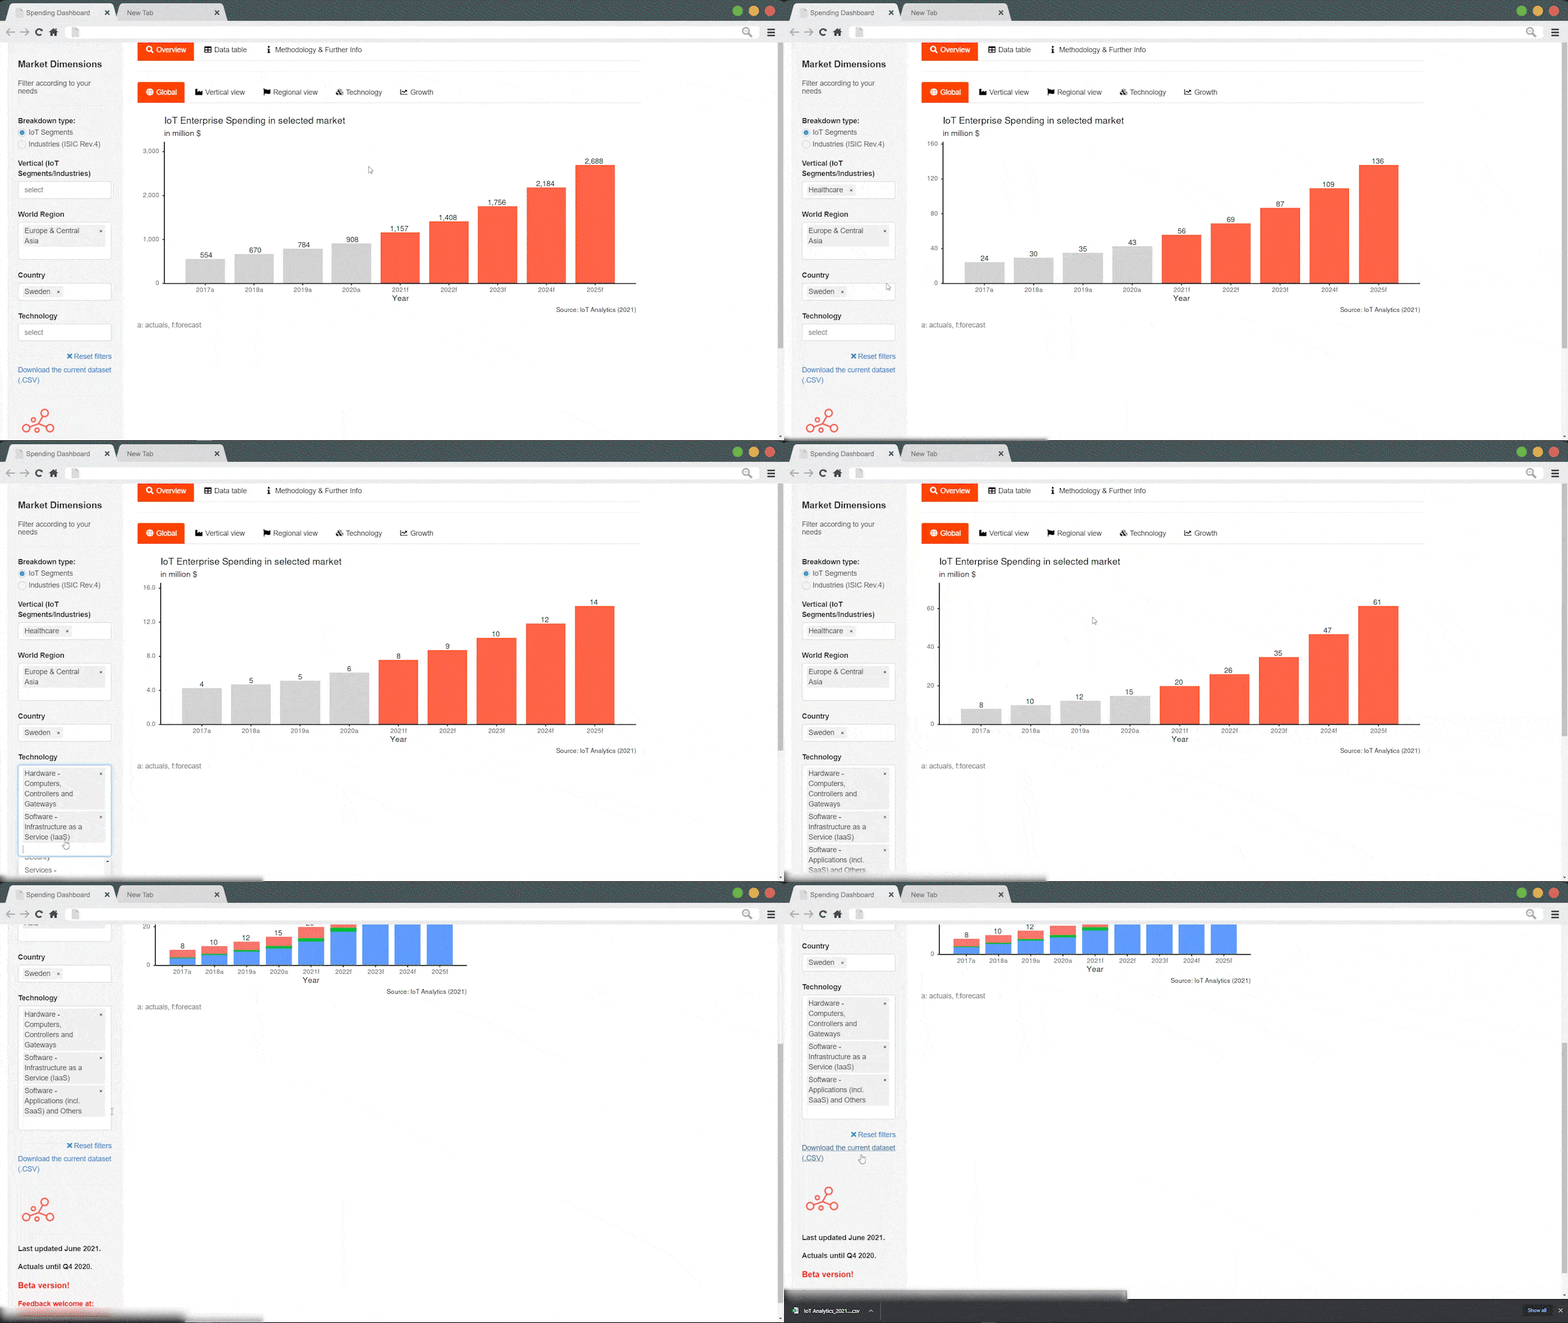
The interactive webtool
Discover the Global IoT Enterprise Spending Dashboard
Your Title Goes Here
Your content goes here. Edit or remove this text inline or in the module Content settings. You can also style every aspect of this content in the module Design settings and even apply custom CSS to this text in the module Advanced settings.
Click to show dashboard
THE UPDATE PROCESS
What we do to update the data
Constant monitoring
Industry-level forecasts
Numerous interviews
Quantification of trends
across 7,000+ earnings calls of listed companies.
Fine-tuning the data
based on the latest IoT end-user surveys of ~1,000 IoT and IT decision-makers.
Updating of macroeconomic forecasts
from trusted sources (e.g., IMF, World Bank, OECD).
Ready to purchase?
Get a holistic understanding of all IoT markets in one user-friendly tool.
Slice and dice the data according to your individual needs.
Receive semi-annual spending data updates.
Use the data as a basis to calculate reliable business cases for all of your IoT projects.
Product specifications
All information about the dashboard at a glance
Included industries
| Agriculture | Buildings | Energy | Health care |
| Manufacturing - Automotive | Manufacturing - Discrete (excl. Automotive) | Manufacturing - Hybrid | Manufacturing - Process |
| Natural resources | Retail | Smart Cities | Supply chain/transportation |
| Others |
Included companies
| ABB | AMD | AMS | AT&T | AWS | Accenture |
| Advantech | Alibaba Cloud | Amphenol | Analog Devices | Beckhoff | Bosch |
| Broadcom | C3.ai | Canon | Capgemini | Check Point Software | China Mobile |
| China Telecom | China Unicom | Cisco | Cognex | Cognizant | Continental Automotive |
| Dahua | Dell | Deloitte | Delta Electronics | Deutsche Telekom | Emerson |
| Ericsson | Fibocom | Fortinet | GalaxyCore | HPE | |
| Hikvision | Hitachi | Honeywell | Huawei | IBM | Infineon |
| Infosys | Intel | Johnson Controls | KDDI | KT Corp | Keyence |
| Knowles Electronics | Kontron | Kyndryl | LGUplus | MiX Telematics | Microlise |
| Microsoft | Mitsubishi Electric | Murata | NTTDocomo | NVIDIA | NXP |
| Neoway | Nikon | Omni Vision | Omron | On Semi | Orange |
| Orbcomm | PTC | Palo Alto Networks | Qualcomm | Quectel | Rockwell |
| SAP | SICK | SIMCom | SKTelecom | ST Micro | Samsung |
| Schneider Electric | Semtech | Sensata Technologies | Sensetime | Siemens | SmartSens technology |
| Softbank | Sony | TCS | TDK | TE Connectivity | TKH Group |
| Teledyne Technologies | Telefonica | Telenor | Telia | Telit Cinterion | Telstra |
| Texas Instruments | Thales | Tmobile USA | Trimble | Verizon | Vodafone |
| Wipro | Wistron Neweb | Yokogawa | u-blox |
Included countries
| Algeria | Angola | Argentina | Australia | Austria | Azerbaijan |
| Bahrain | Bangladesh | Belarus | Belgium | Bolivia | Bosnia and Herzegovina |
| Brazil | Bulgaria | Canada | Chile | China | Colombia |
| Congo (Democratic Republic) | Costa Rica | Cote d'Ivoire | Croatia | Cyprus | Czechia |
| Denmark | Dominican Republic | Ecuador | Egypt | Estonia | Ethiopia |
| Finland | France | Georgia | Germany | Ghana | Greece |
| Guatemala | Guyana | Hong Kong | Hungary | Iceland | India |
| Indonesia | Iran | Iraq | Ireland | Israel | Italy |
| Japan | Kazakhstan | Kenya | Korea (Republic) | Kuwait | Latvia |
| Lithuania | Luxembourg | Macao | Malaysia | Mexico | Morocco |
| Myanmar | Netherlands | New Zealand | Nigeria | Norway | Oman |
| Other - East Asia & Pacific | Other - Europe & Central Asia | Other - Latin America & Caribbean | Other - Middle East & North Africa | Other - South Asia | Other - Sub-Saharan Africa |
| Pakistan | Panama | Papua New Guinea | Paraguay | Peru | Philippines |
| Poland | Portugal | Puerto Rico | Qatar | Romania | Russian Federation |
| Saudi Arabia | Serbia | Singapore | Slovakia | Slovenia | South Africa |
| Spain | Sri Lanka | Sweden | Switzerland | Tanzania | Thailand |
| Tunisia | Turkey | Ukraine | United Arab Emirates | United Kingdom | United States |
| Uruguay | Uzbekistan | Venezuela | Viet Nam |
Latest data releases

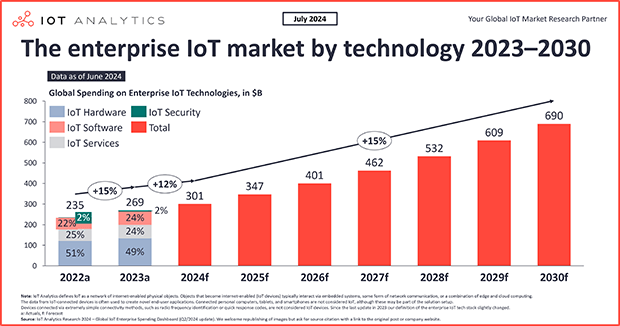
IoT market update: Enterprise IoT market size reached $269 billion in 2023, with growth deceleration in 2024
In short The enterprise IoT market size reached $269 billion in 2023, representing 15% growth year-over-year, according to the Global IoT Enterprise Spending dashboard (Q2/2024 update). Growth is expected to slow further to 12% in 2024 before re-accelerating in 2025. Economic concerns have...

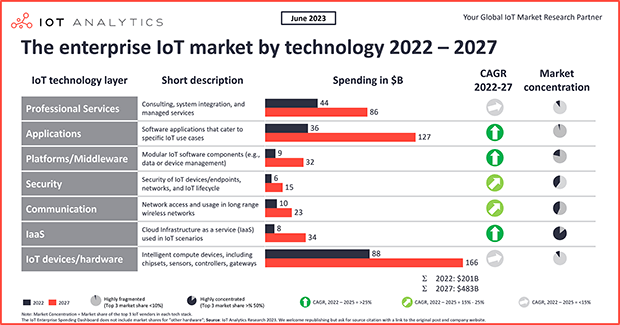
Winning in IoT: How the enterprise IoT market is evolving
In short IoT enterprise spending reached $201 billion in 2022, significantly lower than many had previously predicted. IoT adopters will focus on building the IoT software backbone, developing IoT applications, and infusing AI in the coming five years. 47% of IoT applications are expected to have...
Our insights are trusted by


Request a free demo
Fill out the form to get in touch with us
- Experience a walk-through of the dashboard via screen share
- Get your specific questions addressed
- Explore how our research can add value to your organization
- Receive individual pricing and bundle

Prajwal Praveen
Sales Manager
Phone: + 49 (0) 408 221 1722
Email: sales@iot-analytics.com

