IoT Enterprise Spending (June 2021 update)

Subscribers only

→ Buy now · See pricing

The IoT Enterprise Spending Dashboard (June 2021 update) comprises the end-user spending of IoT markets globally and offers a holistic view with over 800,000 data points and detailed drill-down options per tech stack, verticals, and regions/countries. The tool is updated with the most recent data every six months. This update: June 2021.

DISCOVER THE INTERACTIVE DASHBOARD

Choose license type:

Not available for purchase online (Available to research subscribers only)

Categories: ,

Description

At a glance

  • Holistic analysis of all IoT markets in one user-friendly tool
  • Ability to slice and dice the data according to individual needs
  • The quantitative basis for any IoT initiative, for example, calculating the business case

Related reading

IoT Analytics published the following article alongside this data release:

Global IoT spending to grow 24% in 2021, led by investments in IoT software and IoT security”.

The IoT Enterprise Spending Dashboard includes IoT spending data from 2017 to 2025 across:

  • 100+ countries from 7 world regions
  • 10 types of technology stack elements
  • 11 IoT segments
  • 75+ industries (ISIC Rev. 4)
Screenshot 1: View actuals and forecasts for any data split (2017–2025).
IoT Enterprise Spending Dashboard - Global view example
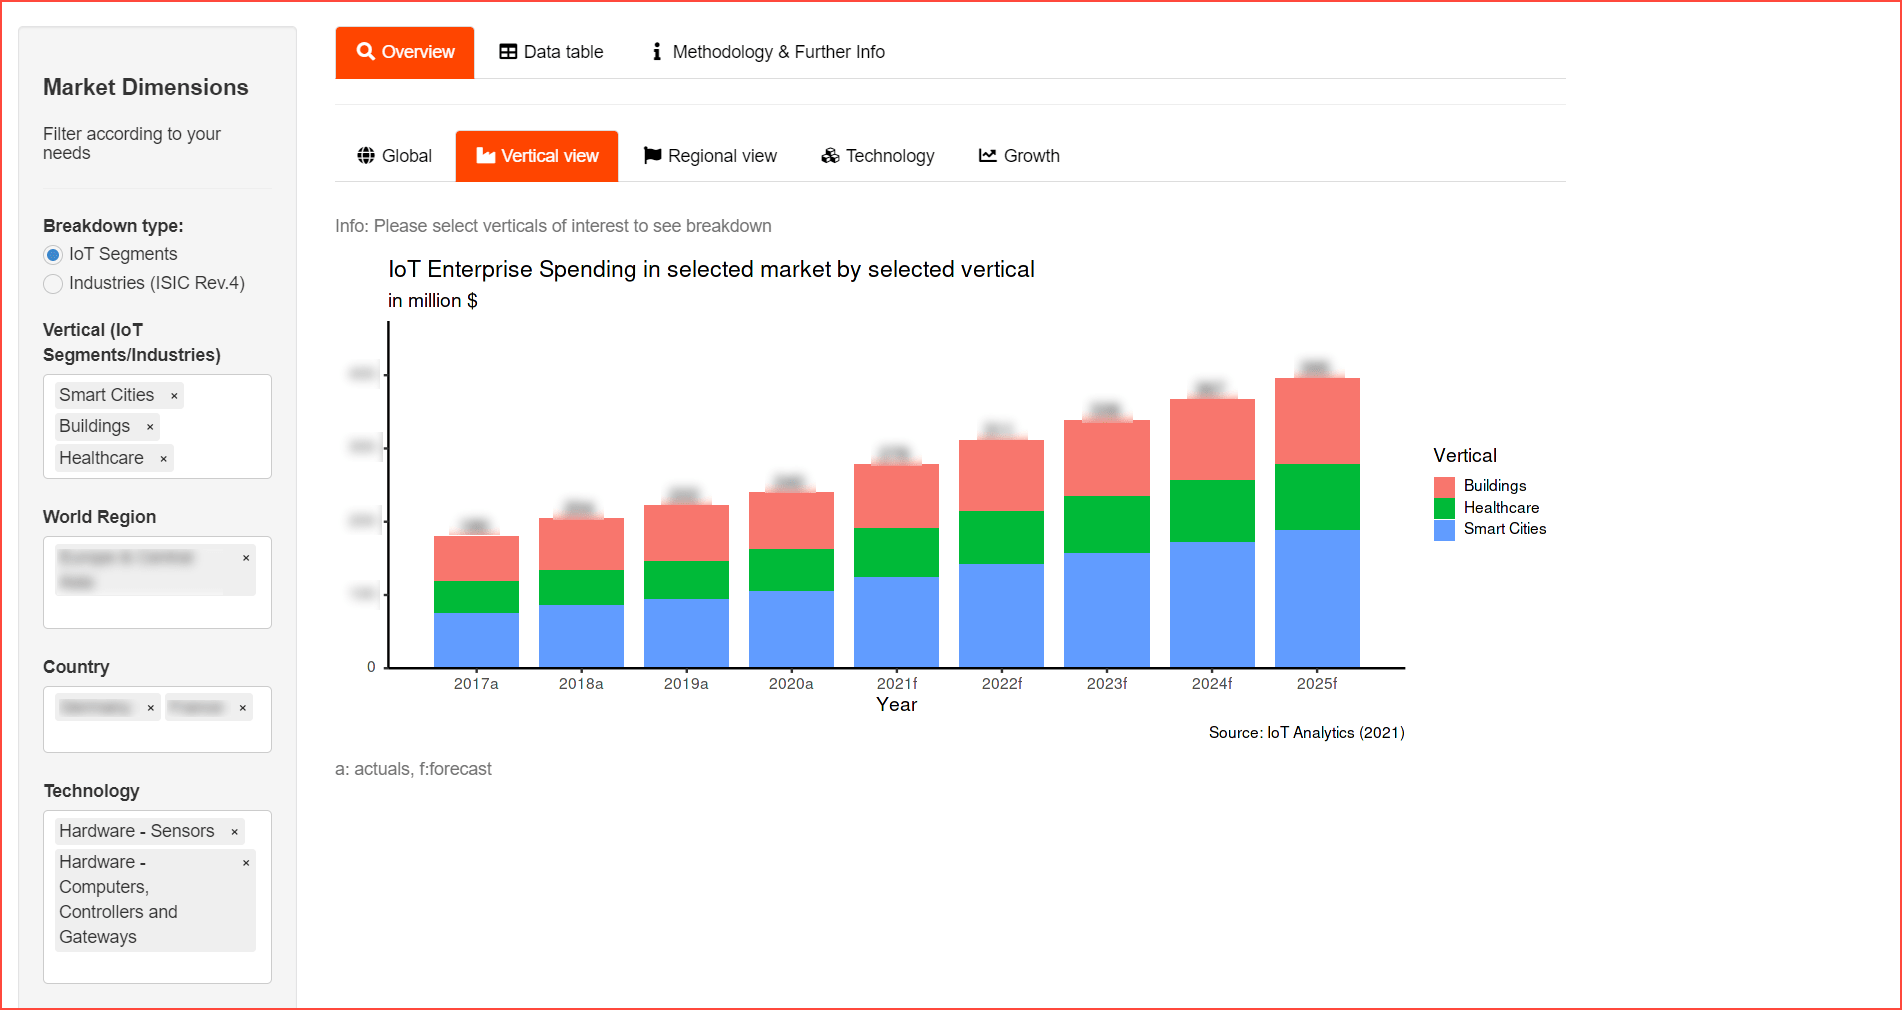
Screenshot 2: The IoT Enterprise Spending Dashboard includes detailed drill-down options per tech stack, verticals, and regions/countries.
IoT Enterprise Spending Dashboard - Vertical view example

Additional information

Publication date

June 2021

License type

Available to Corporate IoT Analytics Research Subscribers only

You may also like…