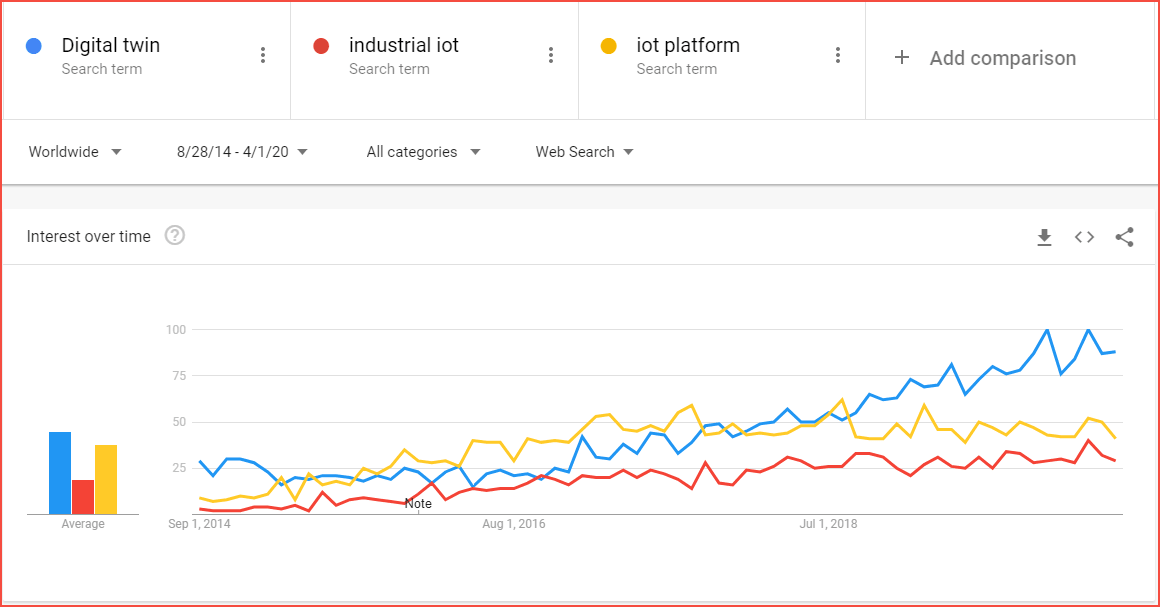
The digitization boom of the last 6+ years has brought up some truly exciting new technology concepts. Digital Twin is one such concept that has gained wide interest and according to Google Trends even tops general search interest in widely searched topics such as the “Industrial IoT” or “IoT Platforms”.
What is a Digital Twin?
Today many companies offer “Digital Twin technology” but a closer comparison reveals vast differences. IoT Analytics recently looked at Digital Twins in-depth and published a 90-page insight report on the topic.
A first glance at the websites of companies that offer Digital Twin technology shows that many definitions for digital twins already exist, however there is no commonly accepted definition.
- Siemens, for example, defines Digital Twins as “a virtual representation of a physical product or process, used to understand and predict the physical counterpart’s performance characteristics”.
- Dassault Systems takes a narrower view and defines Digital Twin technology as “a virtual representation of what has been produced.”
- IBM limits the scope to real-time data and defines it as “a virtual representation of a physical object or system across its lifecycle, using real-time data to enable understanding, learning and reasoning”.
The commonality in most definitions is that Digital Twins are a “digital abstraction or representation of a physical system’s attributes and/or behavior”. The devil is in the details because one could still refer to a fully-automated dynamically-recalibrating virtual representation of a physical system or alternatively just one software element of that setup – or something else.
The 250 classifications of Digital Twin technology
The research that IoT Analytics performed on the topic showed that there are 3 dominant dimensions by which Digital Twins can be classified:
- The hierarchical level the Digital Twin is applied to (6 levels identified)
- The lifecycle phase in which the Digital Twin is used (6 phases identified)
- The use of the Digital Twin (7 most common uses identified)
There are 252 potential combinations of the 6 levels, 6 phases, and 7 most common uses (6x6x7=252), all of which describe a different classification of a Digital Twin.
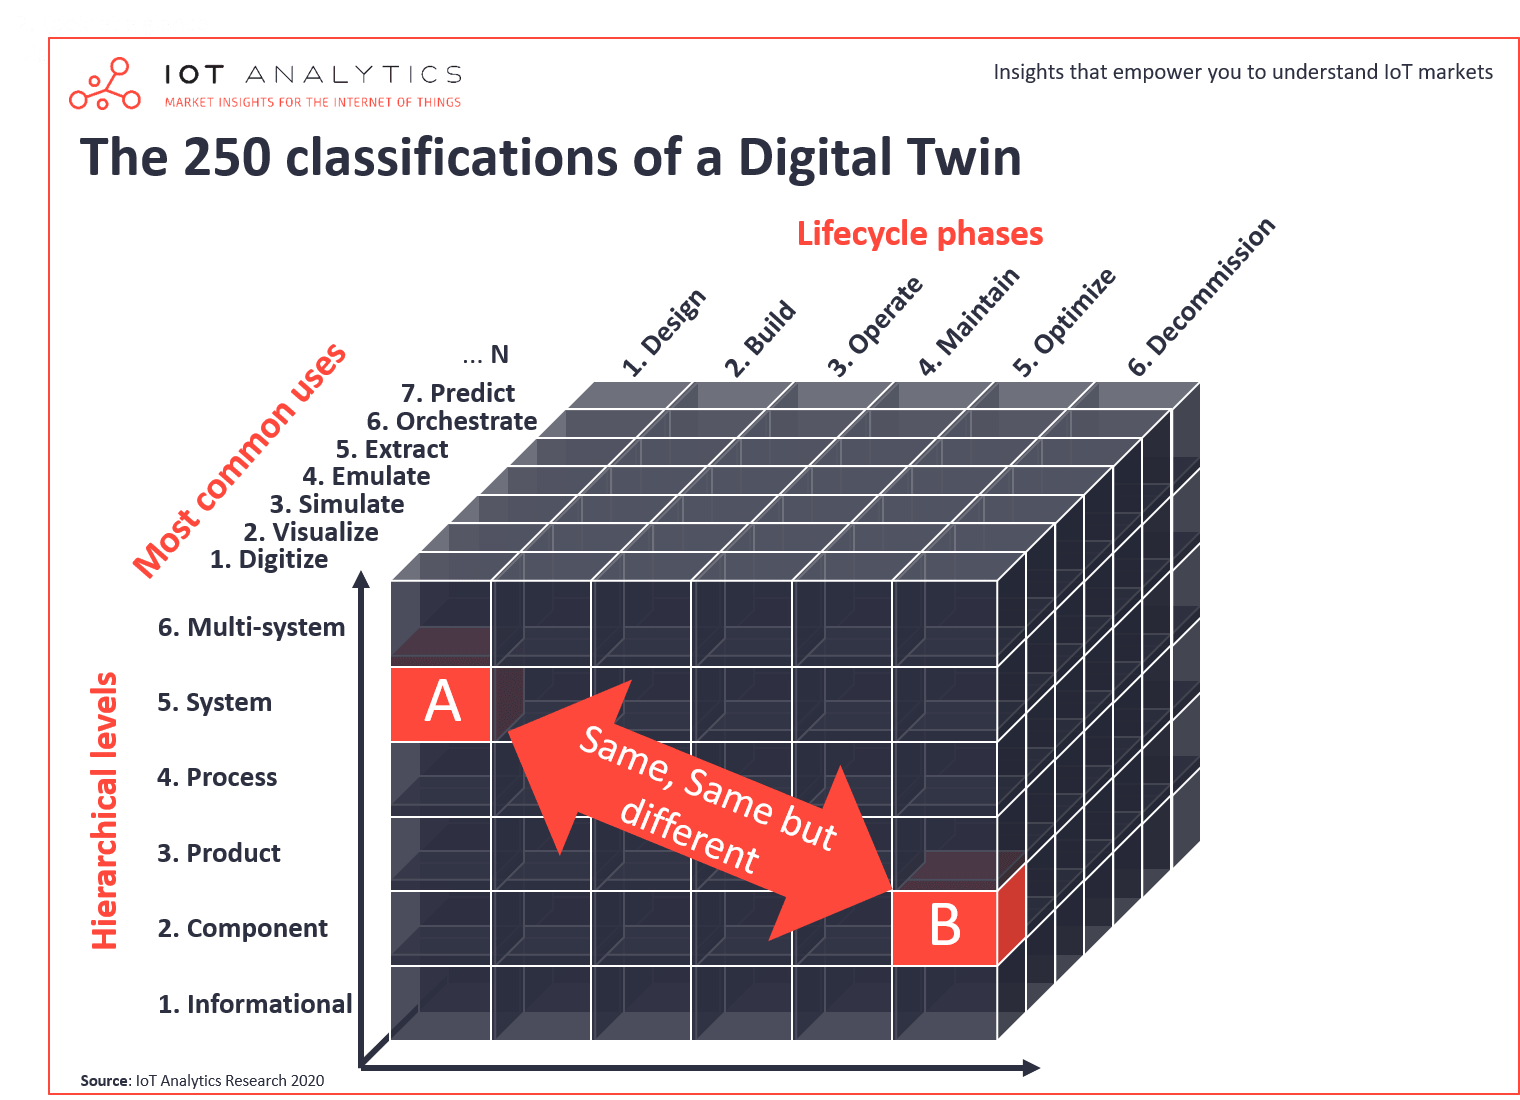
The resulting Digital Twin cube explains why a digital replica which is used for a “product simulation during the design phase” is completely different to a “process parameter prediction during manufacturing operations”. Both are called Digital Twin but only have limited overlap.
One should note that a fourth dimension could be added to describe the data type used in the digital twin use case. One could make use of real-time data, historical data, or simply test data. For simplicity reasons this was not visualized.
The 3 Dimensions of digital twin technology
Dimension 1: Hierarchical levels
There are 6 hierarchical levels of a digital twin.
- Informational: Digital representations of information e.g., an operations manual in digital format.
- Component: Digital representations of individual components or parts of a physical object e.g., virtual representation of a bolt or a bearing in a robotic arm.
- Product: Digital representations of the interoperability of components/parts as they work together at a product level e.g., virtual representation of a rotating robotic arm.
- Process: Digital representations enabling the operation and maintenance of entire fleets of disparate products that work together to achieve a result at a process level e.g., virtual representation of a manufacturing production line process.
- System: Digital representations twinning multiple processes and workflows, not just limited to physical objects, enabling the optimization of operations at a system level e.g., virtual representation of an entire manufacturing system.
- Multi-system: Digital representations of multiple systems working together as one unified entity to enable unprecedented insight, testing and monitoring of key business metrics in a data-driven manner e.g., virtual rep. of several systems working in unison such as systems for industrial manufacturing, supply chain, traffic control, communication, HR, etc.
Dimension 2: Lifecycle phases
There are 6 lifecycle phases in which digital twins are applied.
- Design: In the design phase, requirements are gathered and one or more designs (e.g., for components, products, processes, or systems) are developed, with which the required outcome can apparently be achieved e.g., using digital twins as the source of all data such as object properties and parameter values for which virtual representations can be build on.
- Build: The build phase takes the code requirements outlined previously and uses those to build the actual software-based digital twin. This phase also covers data management, configuration provisioning, repository management and reporting e.g., using digital twins to virtually build and simulate prototypes without having to build more cost intensive physical counterparts for testing.
- Operate: The operation phase is when actual users start using online digital twins in active deployments. Typical operative tasks include extracting sensor data or orchestrating devices remotely e.g., using digital twins to extract real-time sensor data from a rotating robotic arm in a production line or updating the device configuration over-the-air.
- Maintain: The maintenance phase involves making changes to hardware, software, and documentation to support its operational effectiveness. It includes making changes to correct problems, enhance security, or address user requirements e.g., using digital twins to do regular maintenance tasks such as sending OTA updates for system configuration or cybersecurity.
- Optimize: The optimize phase requires use of existing capability information and a statistical approach to tolerancing. This can used to improve development of detailed design elements, predicting performance, and optimizing operations e.g., using digital twins to run a large amount of tests that generate insights to help predict future performance and failures.
- Decommission: The decommissioning phase involves the removal of a digital twin release from use. This activity also known as system retirement or system sunsetting e.g., using digital twins to remotely decommission devices no longer in use and subsequently retire the use of that corresponding digital twin.
Dimension 3: Most common uses
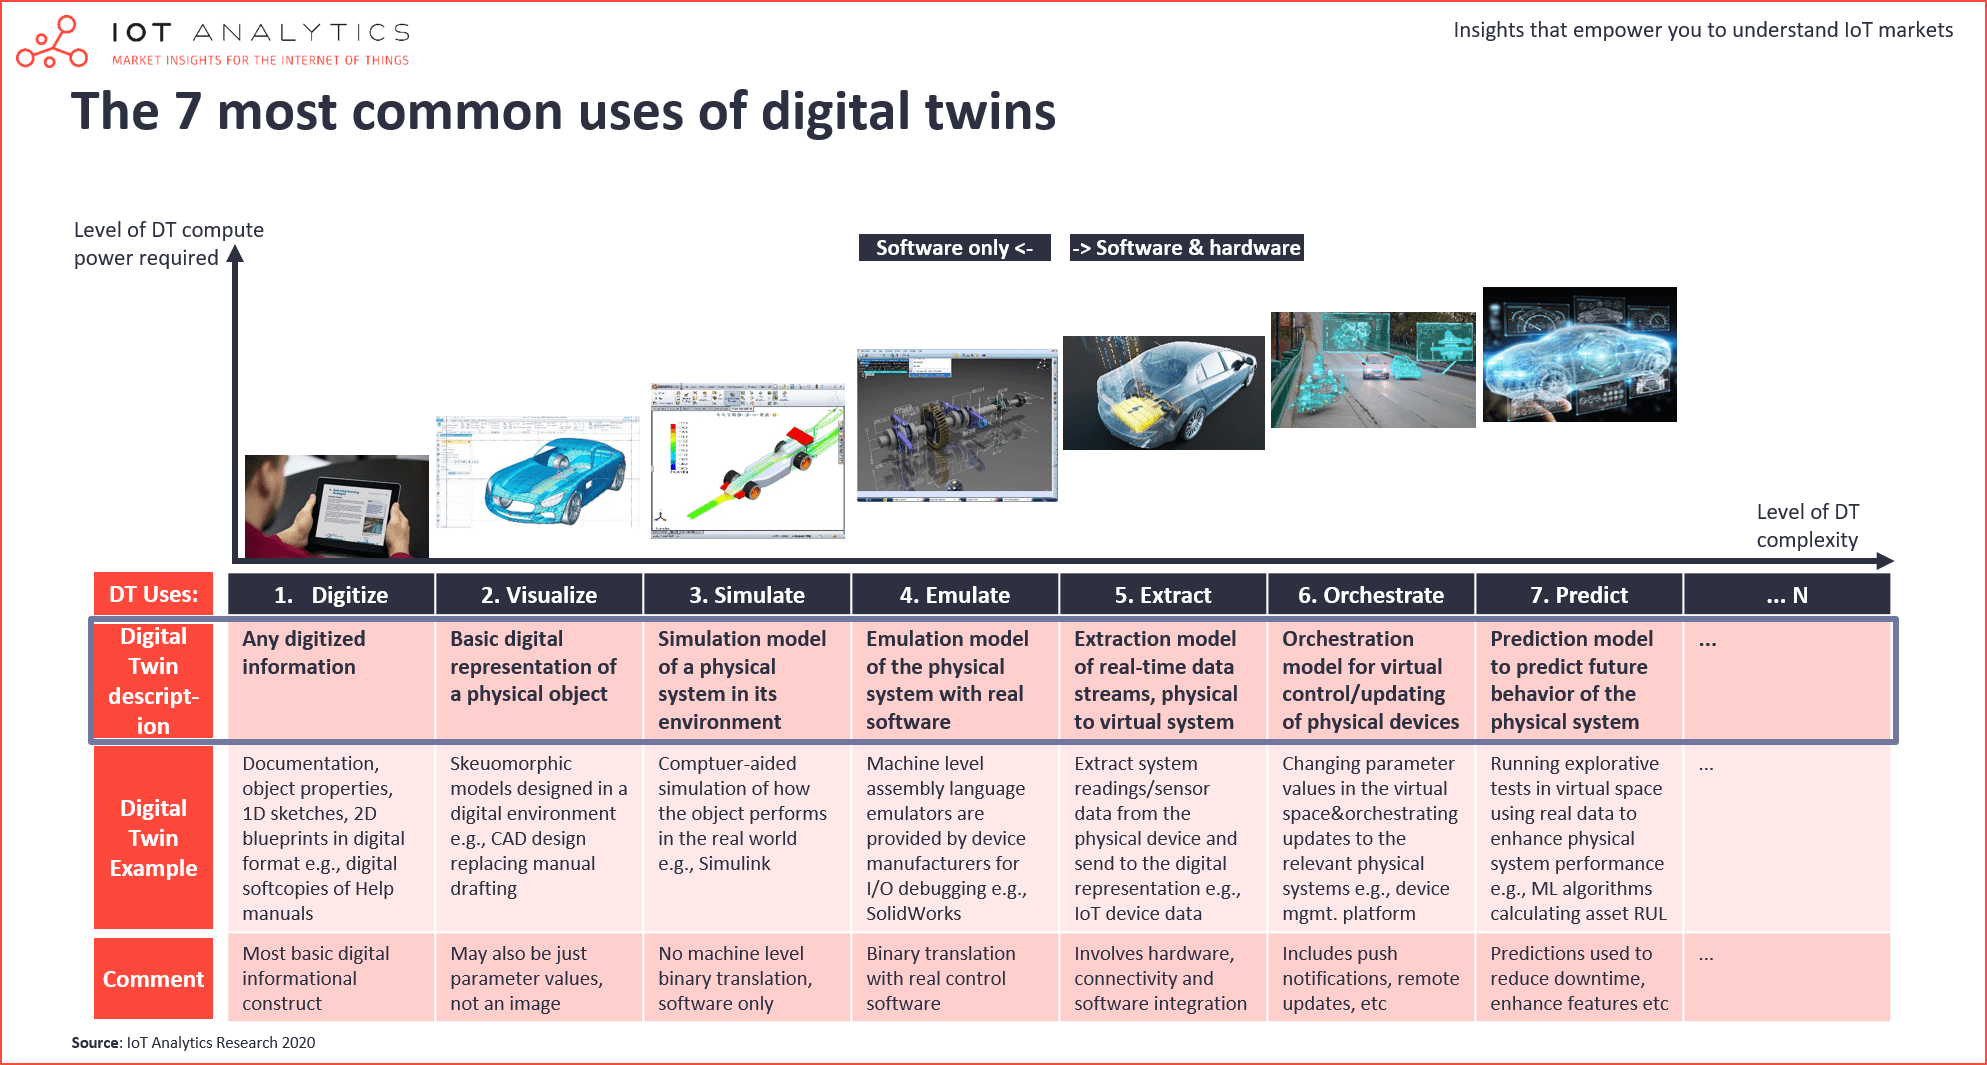
A multitude of uses exist for digital twins, 7 of the most common uses are highlighted here:
- Digitize: Any digitized information
- Visualize: Basic digital representation of a physical object
- Simulate: Simulation model of a physical system in its environment
- Emulate: Emulation model of the physical system with real software
- Extract: Extraction model of real-time data streams, physical to virtual system
- Orchestrate: Orchestration model for virtual control/updating of physical devices
- Predict: Prediction model to predict future behavior of the physical system
Typical Digital Twin examples classified
While there are technically 252 different classifications of a digital twin according to the cube model, not all occur equally often in reality. Our analysis of 30+ Digital Twin case studies shows that the following 3 are among the more common Digital Twin technology uses.
1. Product x Design x Visualize:
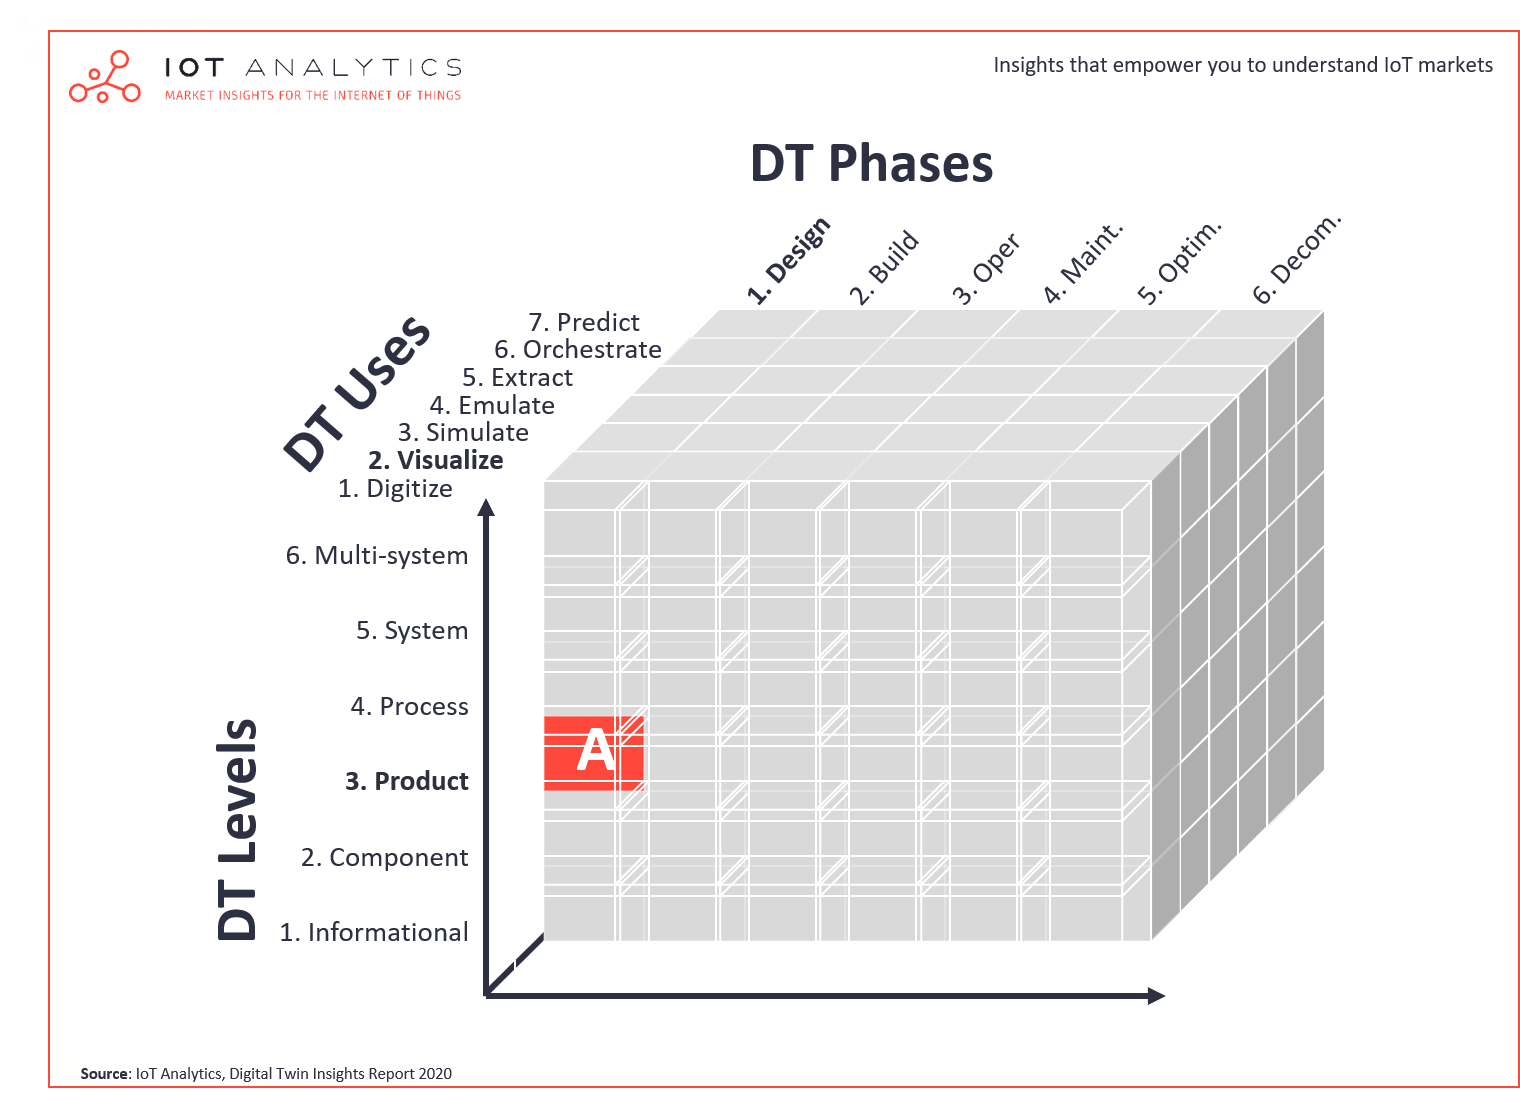
Companies often use Digital Twin technology to visualize their product in the design phase in order to save time in developing the optimal design and save costs by building fewer physical prototypes. An example discussed in the IoT Analytics report is the visualization a virtual mechatronic design model for a new, automated packaging machine.
2. Process x Build x Simulate:
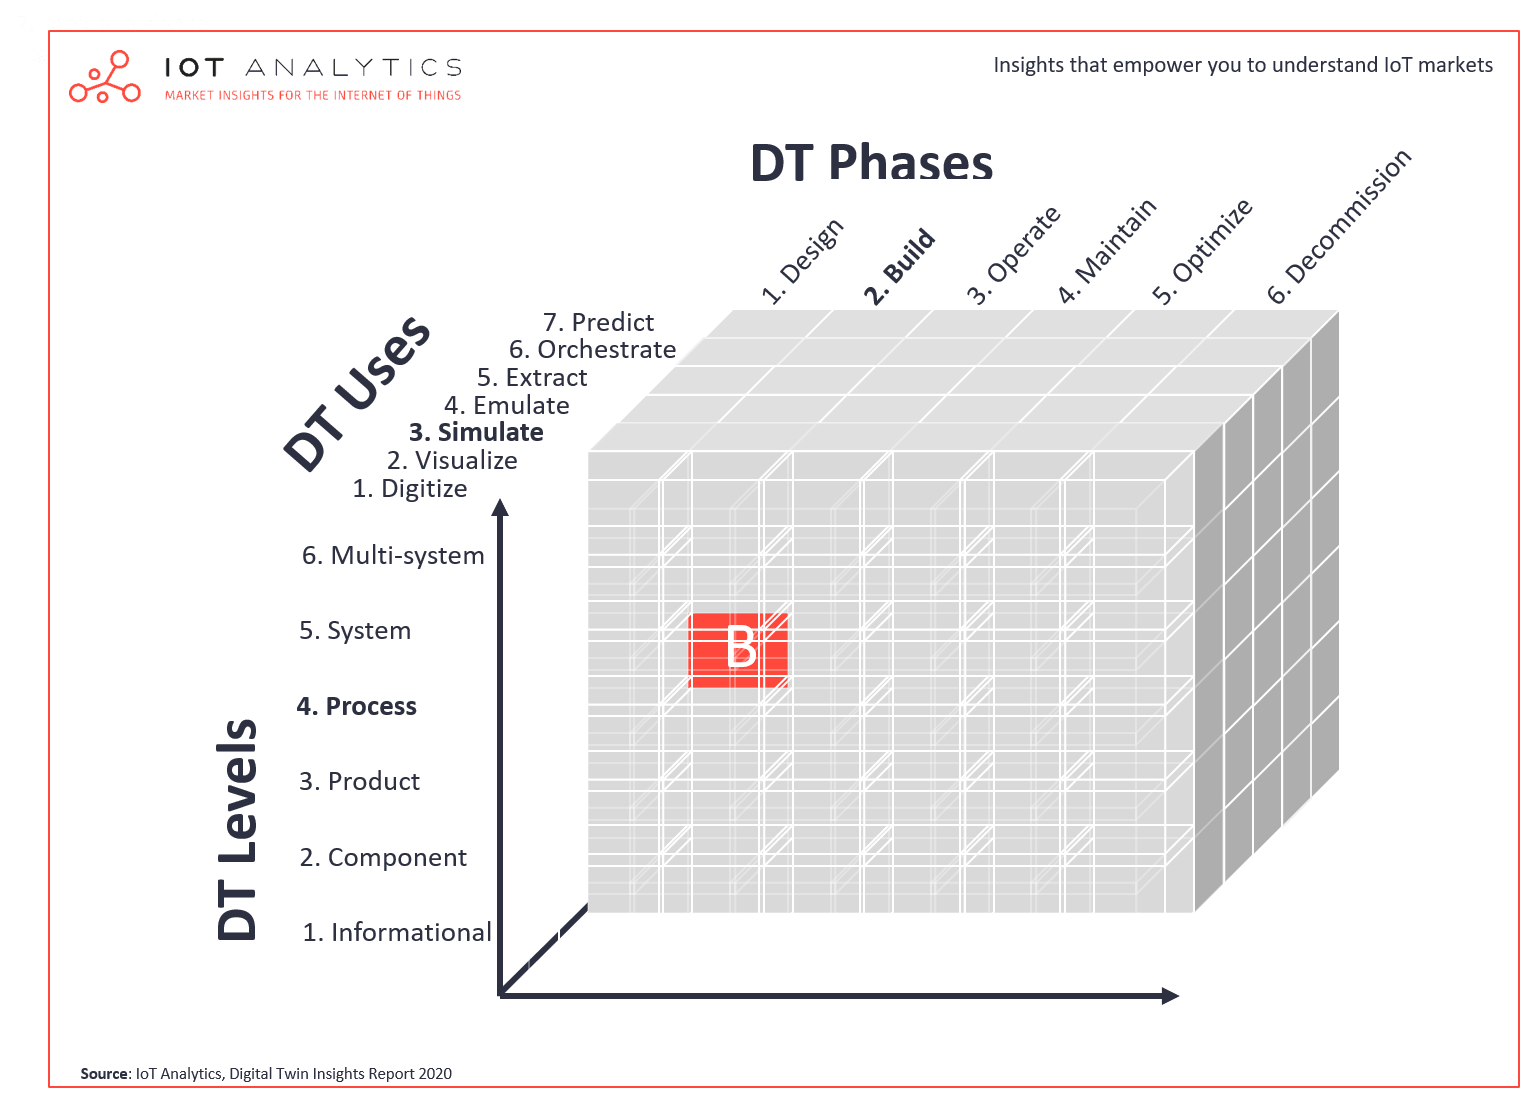
Many companies use Digital Twin technology to simulate their processes in the build phase in order to test and validate that all the products integrated are aligned and working as expected before releasing the process update (or new process) into production. An example discussed in the IoT Analytics report is the simulation of new processes being rolled out in a power plant.
3. Multi-system x Optimize x Predict:

Companies also often use Digital Twin technology to predict multi-system outcomes in the optimize phase in order to predict performance improvements based on fine tuning and tweaking current parameters. An example discussed in the IoT Analytics report is prediction and optimization of operational scenarios and workflows in a hospital.
More information and further reading
Interested in learning more about digital twins?
The 90-page Digital Twin Insights Report 2020 is part of IoT Analytics’ ongoing coverage of IoT Platforms/Software (IoT Platforms/Software Research Workstream). The main purpose of the report is to help our readers understand the current Digital Twin landscape by defining and analyzing the market.
This report provides answers to the following questions (among others):
- What is a Digital Twin (definition)?
- What are examples of successful digital twin implementations?
- Who are the key players offering Digital Twin technology and what is their offering?
- What are the main trends shaping the digital twin market?
- What are the key challenges associated with building digital twins?
- What standardization efforts exist for digital twins?
- How is Covid-19 affecting the digital twin market?
- What is the end-user view of digital twins in terms of adoption, ROI, and budgeting?
A sample of the report can be downloaded here:
Are you interested in continued IoT coverage and updates?
Subscribe to our newsletter and follow us on LinkedIn and Twitter to stay up-to-date on the latest trends shaping the IoT markets. For complete enterprise IoT coverage with access to all of IoT Analytics’ paid content & reports including dedicated analyst time check out Enterprise subscription.
